
Woodinville·Septic System Repair
Woodinville Septic Pump Replacement
A new pump installation in Woodinville. The chamber beside the deck was opened up, the old pump assembly removed, and the replacement fitted with new pipework and wiring.
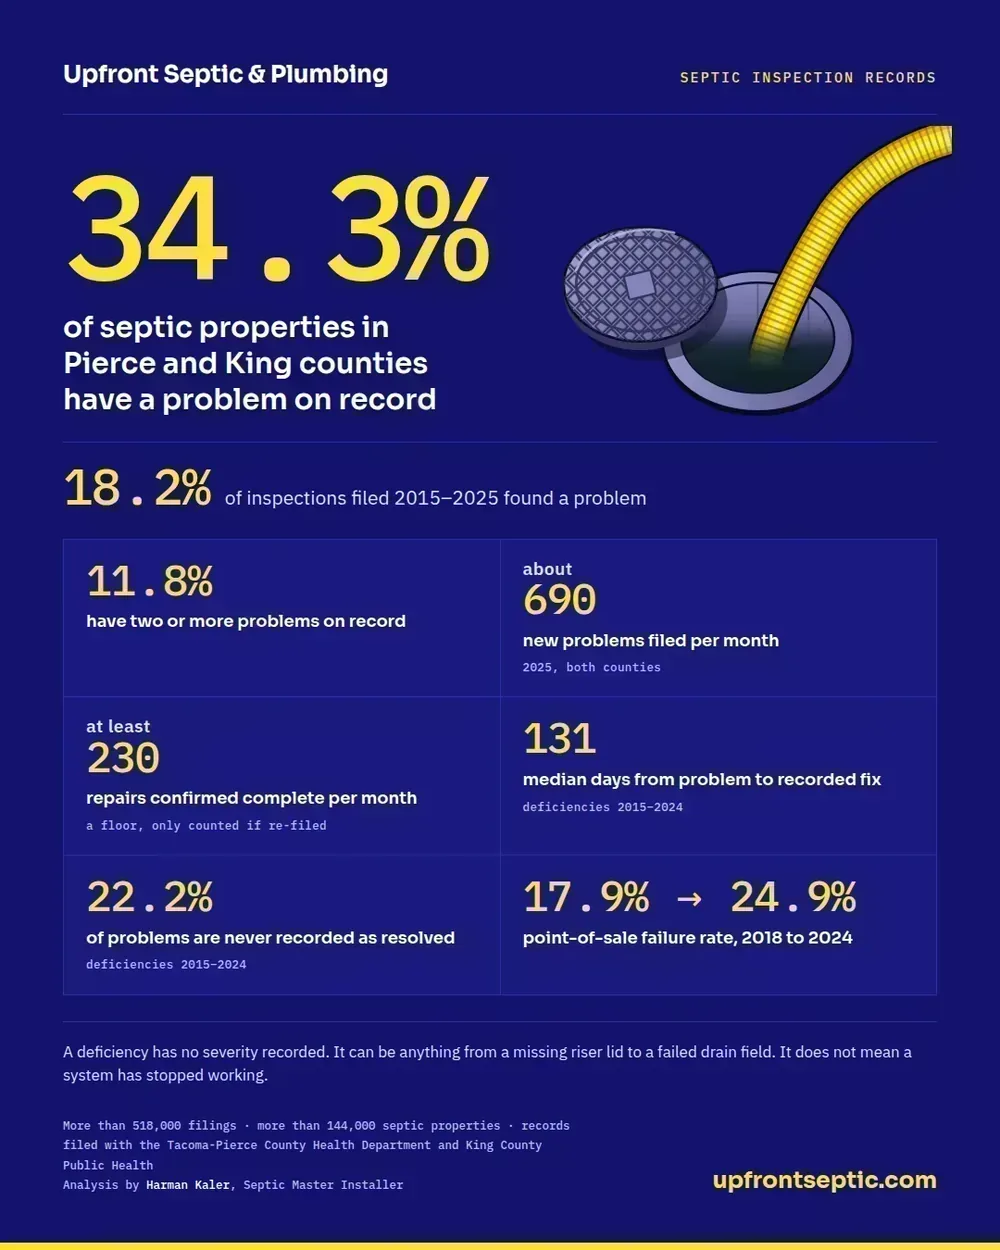
Of the septic inspections filed in Pierce and King counties between 2015 and 2025, 18.2% found a problem. Across more than 144,000 properties on septic in the two counties, 34.3% have at least one on record.
Based on operation-and-maintenance records filed with the Tacoma-Pierce County Health Department and King County Public Health covering more than 144,000 septic properties, 1997–2026.
Washington requires every on-site septic system to be inspected on a fixed cycle, and the inspector has to file a report with the county health department. That makes the record of what inspectors find close to complete rather than a survey. That is what lets these numbers be stated as rates instead of estimates.
In 2025, inspectors filed about 690 new problems a month across the two counties. Repairs recorded as complete over the same period came to at least 230 a month. That figure is a floor, not an estimate: a repair only enters the record when someone returns to the property and files the fix, so work completed without a follow-up filing is not counted.
| Measure | Figure | What it covers |
|---|---|---|
| Inspections that found a problem | 18.2% | Routine and point-of-sale, both counties, 2015–2025 |
| Septic properties with a recorded problem | 34.3% | Of more than 144,000 properties |
| Properties with two or more problems | 11.8% | Repeat issues |
| New problems filed per month | about 690 | 2025, both counties |
| Repairs confirmed complete per month | at least 230 | 2025; a floor, not an estimate |
| Median days from problem to recorded fix | 131 | Deficiencies 2015–2024 |
| Problems never recorded as resolved | 22.2% | Deficiencies 2015–2024 |
| Point-of-sale failure rate, 2018 to 2024 | 17.9% → 24.9% | Both counties |
A deficiency is not the same thing as a broken system. The records carry no severity field, so a deficiency covers everything from a missing riser lid to a failed drain field. What the figures above measure is how often an inspector wrote something down, not how often a septic system stopped working.
The strongest predictor of whether an inspection finds a problem is not the age of the system or where it is. It is why the inspector was there in the first place.
| Measure | Figure | What it covers |
|---|---|---|
| Inspections triggered by a complaint | 45.8% | Found a problem |
| Routine scheduled inspections | 17.4% | Found a problem |
| Inspections of brand-new systems | 2.7% | Found a problem |
A complaint callout is roughly seventeen times more likely to turn up a problem than an inspection of a newly installed system. Put the other way round: by the time something is noticeable enough to complain about, the chance that an inspector confirms it is close to one in two.
For problems recorded between 2015 and 2024, the median time from a deficiency being filed to a repair being filed was 131 days. That is the middle of the distribution, and the distribution has a long tail: a quarter of these took more than 651 days to reach a recorded fix.
22.2% have no repair on record at all. Some of those were certainly fixed; a repair only appears in the data if someone came back and filed it, and plenty of work gets done without a second visit being logged. But it means that for more than one problem in five, the public record still shows an open deficiency and nothing after it.
This is the part of the picture nobody else publishes, and it is the practical argument for dealing with a deficiency quickly rather than at leisure. A problem that sits in the record unresolved is a problem that turns up again when the property is sold.
Washington requires an inspection when a property on septic changes hands, which makes the point-of-sale inspection the one nobody can skip, and the one where a deficiency has an immediate cost attached to it.
Point-of-sale inspections found a problem 17.9% of the time in 2018 and 24.9% in 2024. Whatever is driving that, the practical effect is that a quarter of septic homes now hit a problem at exactly the point in the transaction where it is most expensive to discover.
The gap between the two counties at point of sale is wide. Between 2015 and 2025, 24.5% of point-of-sale inspections in King County found a deficiency, compared with 15.0% in Pierce County. These are rates per inspection filed, which is the only fair way to compare the two: properties in the two counties are observed over different lengths of time, so a comparison per household would flatter one county for arithmetical reasons rather than real ones.
These are the septic services we offer across Pierce and King County. Repair rarely starts with a repair; it starts with finding out which part of the system is actually failing.
Upfront Septic & Plumbing is built on reliability, transparency, and quality service. We show up when we say we will, explain the work clearly, and provide honest pricing. Our goal is to deliver long term solutions, not quick fixes.
We take pride in serving local communities and building lasting relationships with our customers through dependable service and professional results.
If you need septic pumping, plumbing services, or 24 hour emergency septic service, Upfront Septic & Plumbing is ready to help. Contact us today to schedule service, request an inspection, or get immediate assistance.
Failure rates are not evenly spread. Across the whole record, 18.2% of inspections found a problem, but that splits into 15.7% in Pierce County and 23.4% in King County, and individual towns range much wider than that.
The 45 towns below are every community in the two counties with enough inspection volume to carry a rate of its own. The spread between the highest and the lowest is nearly five-fold: 35.5% in Burien against 7.2% on Anderson Island.
| City | County | Homes on septic | Inspections | Inspections finding a problem |
|---|---|---|---|---|
| Burien | King | 1,524 | 1,187 | 35.5% |
| Des Moines | King | 609 | 501 | 35.3% |
| Kirkland | King | 911 | 836 | 29.9% |
| Federal Way | King | 2,865 | 2,541 | 29.5% |
| Seattle | King | 1,103 | 1,306 | 28.1% |
| Renton | King | 4,616 | 4,678 | 27.6% |
| Auburn | King | 5,841 | 5,616 | 26.4% |
| Bellevue | King | 1,076 | 1,305 | 26.4% |
| Covington | King | 1,185 | 1,153 | 25.5% |
| Kent | King | 4,121 | 4,995 | 24.5% |
| Sammamish | King | 2,426 | 2,790 | 23.0% |
| Maple Valley | King | 2,641 | 2,696 | 22.8% |
| Lakewood | Pierce | 1,032 | 993 | 22.3% |
| Woodinville | King | 6,385 | 7,642 | 22.1% |
| Snoqualmie | King | 429 | 512 | 22.1% |
| Issaquah | King | 2,418 | 2,954 | 21.9% |
| Duvall | King | 1,045 | 1,204 | 21.7% |
| Black Diamond | King | 720 | 598 | 21.7% |
| University Place | Pierce | 1,469 | 1,702 | 20.6% |
| Fall City | King | 1,076 | 1,352 | 20.6% |
| Redmond | King | 3,761 | 4,965 | 20.5% |
| Carnation | King | 1,268 | 1,617 | 20.0% |
| North Bend | King | 2,354 | 2,610 | 19.5% |
| Bonney Lake | Pierce | 5,618 | 6,748 | 18.9% |
| Spanaway | Pierce | 7,048 | 7,847 | 18.3% |
| Enumclaw | King | 2,584 | 2,096 | 18.2% |
| Edgewood | Pierce | 3,210 | 6,442 | 18.0% |
| Vashon | King | 3,367 | 4,851 | 17.8% |
| Tacoma | Pierce | 8,003 | 12,920 | 17.7% |
| Puyallup | Pierce | 2,660 | 3,114 | 17.7% |
| South Hill | Pierce | 10,115 | 11,996 | 17.6% |
| Sumner | Pierce | 483 | 1,169 | 17.4% |
| Lake Tapps | Pierce | 4,201 | 11,101 | 16.6% |
| Graham | Pierce | 7,118 | 9,405 | 16.5% |
| Ravensdale | King | 868 | 780 | 16.5% |
| Gig Harbor | Pierce | 16,738 | 29,400 | 14.4% |
| Orting | Pierce | 1,716 | 2,090 | 14.2% |
| Buckley | Pierce | 3,217 | 4,549 | 12.9% |
| Fox Island | Pierce | 1,473 | 2,494 | 12.8% |
| Roy | Pierce | 3,427 | 5,044 | 11.8% |
| Lakebay | Pierce | 2,377 | 4,725 | 11.7% |
| Vaughn | Pierce | 569 | 1,238 | 11.6% |
| Eatonville | Pierce | 2,461 | 4,534 | 11.1% |
| Longbranch | Pierce | 581 | 1,519 | 10.5% |
| Anderson Island | Pierce | 831 | 953 | 7.2% |
The pattern is county-shaped: nine of the ten highest rates are in King County, and the ten lowest are all in Pierce. Denser, older suburban areas run higher than rural ones, and the lowest rates in the region are on Anderson Island and the Key Peninsula.
That is a pattern in the records rather than a demonstrated cause. These filings record what an inspector found, not the age of the house, the age of the system, or the soil it sits in. The reason for the gap is therefore a hypothesis and not a finding.
The inspection rules also differ by county, which is worth knowing before reading too much into any single row.
The US Environmental Protection Agency estimates that about 20% of American homes are on septic, that 10 to 20% of septic systems fail during their operational lifetime, and that failing systems are the third most common source of groundwater contamination.
The EPA estimates that 10 to 20% of septic systems fail during their operational lifetime. In Pierce and King counties, where inspections are mandatory and recorded, 34.3% of septic properties have had at least one documented deficiency, though a recorded deficiency covers everything from a minor maintenance item to a failed drain field.
Those two figures measure different things, and the reason is worth stating. The EPA's is an estimate of how many systems fail across a working life. Ours is a count of what inspectors wrote down, and it exists because Washington does not leave inspection to the owner's discretion: every on-site system is on a fixed cycle. Gravity and pressure systems are inspected every three years, complex ones annually, and the inspection is carried out by a county-certified operation-and-maintenance specialist who files a report with the health department.
Washington requires an inspection when a property on septic changes hands, so the point-of-sale figures above cover effectively every sale rather than a sample. Both governing rules changed recently. King County revised Board of Health Title 13 in June 2025, and the state revised its own on-site sewage rule the same year.
The questions people actually search for, answered from our own records and our own service pages rather than from general advice.
Septic repair covers a wide range of work, from a missing riser lid to a failed drain field, and the price varies with the job. That is why we do not publish a single repair figure. What is fixed is the diagnosis: a septic inspection is a flat $299 however long the visit takes, and it establishes which part of the system is actually the problem. The repair itself is quoted from what that inspection finds. If we find a problem and you decide to go ahead with the repair, we will often reduce the inspection fee and bundle it into the cost of the repair.
Sometimes, and it depends entirely on why it stopped working. A drain field saturated after heavy rain is a different problem from one that has been compacted or clogged over years. Your drain field is the part of the septic system that distributes liquids back into the soil. Depending on the problem, it may or may not be fixable. A septic inspection can help you determine the exact issue and give you a better idea of your repair options.
Legally, no. The Washington State Department of Health publishes a homeowner septic inspection video and says plainly that it does not qualify homeowners to inspect their own systems; your local health jurisdiction sets who may inspect and what training that takes. In Pierce and King counties the inspection that goes on the record has to be filed by a certified operation-and-maintenance specialist, so you cannot diagnose a problem and sign off on your own repair. Attempting to fix a septic problem yourself is a risky decision, and one that could cost you much more in the long run.
Source: Washington State Department of Health, Do It Yourself Inspection Video
Forty years, sometimes longer with proper care. The lifespan varies widely with the type of tank, the materials it is built from and how well it has been maintained.
Chemical drain cleaner. Drano is not recommended for septic systems, despite what the official Drano website says. Bleach, flushable wipes and a garbage disposal all cause problems too, and we have written about each of them.
Unfortunately, the health department records do not include data about causes of failures, only whether or not a septic system was deficient at inspection. While we do not have data about which issues are most common, homeowners should be on the lookout for heavy water usage, insufficient maintenance, and flushing of improper items such as “flushable” wipes and household chemicals.
About this analysis. Washington requires every on-site septic system to be inspected on a recurring cycle: at least every three years for a septic tank with a gravity drain field, and every year for anything more complex. Each county adds to that. King County inspects anything non-gravity annually, and Pierce County assigns each system a risk classification that sets how often the result must be reported to the health department — annually at high risk and every three years at moderate risk. The inspection must be carried out by a county-certified operation-and-maintenance specialist who files a report with the health department. Those filings are public records.
This analysis covers more than 518,000 filings for over 144,000 septic properties in Pierce and King counties, spanning 1997 to August 2026, as recorded by the Tacoma-Pierce County Health Department and King County Public Health. Because inspection is mandatory rather than voluntary, this is a near-complete record of professional septic service in both counties rather than a survey sample: there is no response bias and nothing is self-reported by homeowners.
Definitions. A deficiency is an inspection filed with a status of Deficient; severity is not recorded, so a deficiency may be anything from a missing riser lid to a failed drain field. A repair is a system recorded as deficient and subsequently recorded as corrected. Repairs completed without a follow-up filing are not counted, so repair figures are a floor rather than an estimate. A failure rate is deficiencies as a share of inspections filed, not of properties, which avoids bias from properties observed over different lengths of time.
Scope and limits. Figures are as of 21 August 2026 and cover 2013–2025 unless stated otherwise; earlier records are too sparse to support trend analysis and 2026 is a partial year. Individual property owners are not identified.
A new pump installation in Woodinville. The chamber beside the deck was opened up, the old pump assembly removed, and the replacement fitted with new pipework and wiring.
Our crew recently completed a septic system repair project for a homeowner in Tacoma, WA after an inspection uncovered significant deterioration inside one of the concrete septic tanks. Once the system was exposed, we found multiple areas where the concrete had begun to break down, including holes and cracks that could allow wastewater to leak […]
This homeowner was experiencing septic system issues, so our crew dug down to expose the tank and inspect the system. After opening the access point, we found a damaged sump pump discharge line that was preventing the system from operating properly. Once the problem was identified, we removed the broken section of pipe, installed a […]

Most residential septic pumping appointments take roughly 30 minutes to two hours, but the actual time depends on the tank size, how easy the tank is to reach, its condition, and how much has built up inside it.

Many Charmin products break down with water and suit a well-maintained septic system, but the product, the amount used and the condition of your tank all matter. What to look for, why flushable wipes are a different question, and when the paper is not the real problem.

King County Public Health inspected food businesses 71,580 times between January 2024 and September 2026, and closed 27 of them. For restaurant plumbing the real risk is not the citation - it is the backup that stops service, and the closure that follows.

What Is a Sump Pump Used For? A Practical Guide for Washington Homeowners What is a sump pump used for? It removes excess water collecting beneath or around the lowest part of a home before that water spreads across a basement floor or soaks a crawl space. In homes dealing with heavy rain, saturated soil, […]

Tacoma Grease Trap and FOG Compliance Laws: How Restaurant Owners Can Stay Compliant Running a restaurant in Tacoma means managing more than great food and customer service. Food service establishments must also comply with local Fats, Oils, and Grease (FOG) regulations designed to protect the city’s wastewater system. Failing to maintain your grease interceptor can […]